Agricultural options have a seasonal structure that is unlike anything in energy or metals markets. Every year, the volatility cycle repeats: implied vol rises in spring planting season, spikes during summer weather events, collapses after harvest is certified in October, and recovers slowly through winter as weather risk builds again for the following year. Any pricing model that does not encode this cycle will systematically misprice options throughout the year.
The USDA Calendar Drives Everything
For corn and soybean options, the USDA's weekly crop progress reports and monthly WASDE (World Agricultural Supply and Demand Estimates) reports are the primary vol-generating events. Traders know these dates months in advance. In the week before a WASDE release, implied vol for nearby corn contracts rises by 2–4 vol points on average. In the week after WASDE, vol collapses by a similar amount as the uncertainty resolves.
This event-driven vol structure means that the vol surface for corn options is not just a function of time to expiry — it is a function of which WASDE releases fall before expiry and how many crop progress reports will be published. A 45-day option that straddles a WASDE release will have higher implied vol than a 45-day option that falls between two WASDE dates, even though the calendar time is identical.
Standard pricing models that use calendar time as the only input to the vol term structure cannot distinguish between these two options. Allasso's agricultural option module uses event-aware time, which weights calendar days by their proximity to known vol events. A WASDE release day counts as approximately 3.5 calendar days in vol-time; a quiet mid-week day in late November counts as 0.7 calendar days. The result is a term structure that correctly prices the event premium without requiring manual vol surface adjustments around each release date.
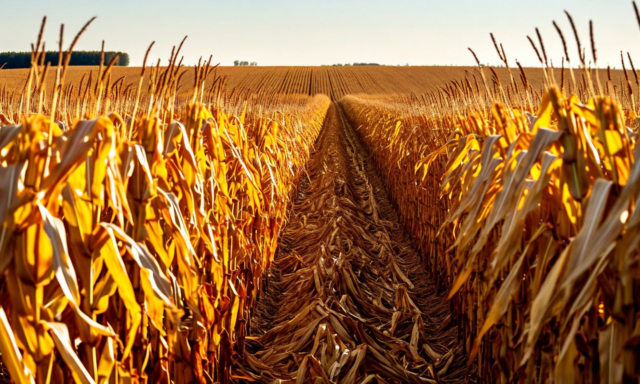
Pre-Harvest vs. Post-Harvest Smile Dynamics
The shape of the corn implied vol smile changes character completely across the harvest date. Before harvest — for July and September CBOT corn contracts — the smile carries put skew. Producers who planted corn are long physical corn and use put options to hedge against price declines from a bumper harvest or poor export demand. The put demand drives up put implied vols relative to call implied vols, producing negative risk reversal (put vol higher than call vol).
After harvest — for December and March CBOT corn contracts — the smile flips. Stored corn is now an inventory asset, and the risk is upward price movement driven by export demand or weather damage to the stored crop. Elevator operators buy call options to hedge their storage optionality. The resulting call demand produces positive risk reversal (call vol higher than put vol).
The magnitude of the flip is large. For nearby corn options, the 25-delta risk reversal moves from approximately -3 vol points in July to +2 vol points in December in a typical year. If your model assumes a static smile shape and you update it only when you observe new market prices, you will consistently misprice puts in July and calls in December. The misfit is not model error — it is the failure to encode the known seasonal demand structure for agricultural options hedging.
Weather Events and Spike Volatility
Between the predictable seasonal structure, agricultural options carry spike volatility risk from weather events. The 2012 US corn drought pushed CBOT July corn from $5.50 to $8.40 between May and August — a 53% move — and implied vol for corn options rose from 22% to 45% during the drought. The 2022 Ukraine conflict pushed wheat options implied vol from 28% to 65% in three weeks.
These spike events require vol models to handle jump risk. A model that assumes continuous vol dynamics — including standard SABR — will underprice out-of-the-money options during periods when jump risk is elevated. For corn and soybean options, jump risk is elevated from late June through August for US crops and from November through February for South American crops (primarily Brazil and Argentina).
Allasso's agricultural module includes a jump risk overlay that uses climate monitoring data — specifically ENSO (El Nino Southern Oscillation) indices, Palmer drought severity indices, and USDA crop condition ratings — as inputs to a jump intensity parameter. When ENSO index indicates elevated La Nina risk and crop condition ratings are declining, the jump intensity parameter rises, which adds a jump risk premium to option prices in the affected season. This approach has historically produced more accurate pricing for out-of-the-money corn and soybean options during weather events than models that rely on implied vol alone.
Multi-Year Crop Cycles: The Long-Dated Option Problem
Agricultural options with tenors exceeding six months face a compounding challenge: they span multiple crop cycles and weather seasons. A March corn option purchased in September 2024 spans the entire northern hemisphere winter, the 2025 spring planting season, and the early summer growing season. Each of these periods has different vol characteristics and different jump risk exposures.
Pricing this option correctly requires a term structure model that allows vol to vary through time in a realistic way, not just decay smoothly toward some long-run mean. Standard mean-reverting vol models — which are common in interest rate options and useful for energy options — apply a single long-run mean reversion speed to the entire term structure. Agricultural vol does not mean-revert uniformly; it mean-reverts quickly after event resolution and stays elevated during weather risk windows.
For long-dated agricultural options, Allasso uses a two-factor vol model where one factor captures the fast mean-reversion of short-run vol spikes and the other captures the slower structural vol level driven by multi-year crop cycle factors (La Nina/El Nino, global grain inventory levels, biofuel mandate cycles). The two-factor model produces long-dated option prices that are systematically lower than single-factor models during La Nina years (when US corn production tends to be better-than-average) and higher during El Nino years.
Brazilian Soybean Calendar vs. US Corn Calendar
A further complication for global agricultural derivatives: the Southern Hemisphere crop cycle runs approximately six months offset from the Northern Hemisphere cycle. Brazilian soybean harvest runs from February through April; US corn harvest runs from September through November. Global grain markets are aware of both supply sources, which means that US corn options vol can be affected by Brazilian soybean crop developments during the Northern Hemisphere off-season.
This cross-market seasonal interaction is particularly relevant for November CBOT soybean options, which expire as US harvest is completing and Brazilian planting is beginning. If Brazilian soybean planting intentions are strong, November soybean options may price in a larger supply overhang than the US harvest data alone would suggest. If a weather concern emerges in the Brazilian Mato Grosso planting region during October, November soybean implied vol may rise even though US harvest is proceeding normally.
Allasso's agricultural module tracks and displays the seasonal vol calendar for both Northern and Southern Hemisphere crop cycles simultaneously, so traders can see at a glance which events in the next 90 days are likely to move implied vol for each agricultural commodity and which markets are seasonally correlated. This calendar view has been particularly requested by European agricultural trading houses with both US and South American physical exposure.
Practical Recommendations for Agricultural Options Desks
Three adjustments make the largest difference for agricultural options desks moving from generic options tools to commodity-specific pricing. First, encode the USDA event calendar in your vol term structure. Even a simple step-function model that adds 3 vol points around each WASDE date will outperform a smooth interpolation scheme on P&L attribution for near-dated options.
Second, allow the smile shape to rotate with the harvest calendar. If your system uses a single skew parameter for the whole year, fit it separately to pre-harvest and post-harvest data and switch between the two seasonally. The improvement in delta accuracy for harvest-year options will be immediate and measurable.
Third, separate weather spike risk from base vol in your risk reporting. The portion of your vega exposure that comes from weather spike risk behaves differently from the portion that comes from base vol uncertainty — the weather component responds to climate data, the base component responds to realized vol. Risk systems that blend these into a single vega number cannot distinguish between a vega position that is benefiting from weather uncertainty and one that is exposed to model error in base vol.